The Colorado River — and the critical water it provides to Arizona — has long been a center of attention for communities and policymakers across the state. But it moved into the national spotlight in August 2021, when the U.S. Secretary of the Interior declared a shortage on the river for the very first time.
Understanding where Arizona’s water goes and how changes affect our supply is a challenging task — even for experts. And with the pressure of new water restrictions that took effect in 2022, more Arizonans are wondering what the shortage means for them.
Arizona State University’s Kyl Center for Water Policy at Morrison Institute and Decision Theater are providing answers with a visualization tool called the The Arizona Colorado River Visualization Enterprise. Also known as the Arizona CuRVE Project, this digital tool will offer detailed information about the shortage’s impacts in a format that anyone can access and understand.
“It's really important for the 40 million people who rely on Colorado River water to have a good idea of what kinds of supply choices there are in the future,” says Sarah Porter, director of the Kyl Center and a Global Futures Scholar.

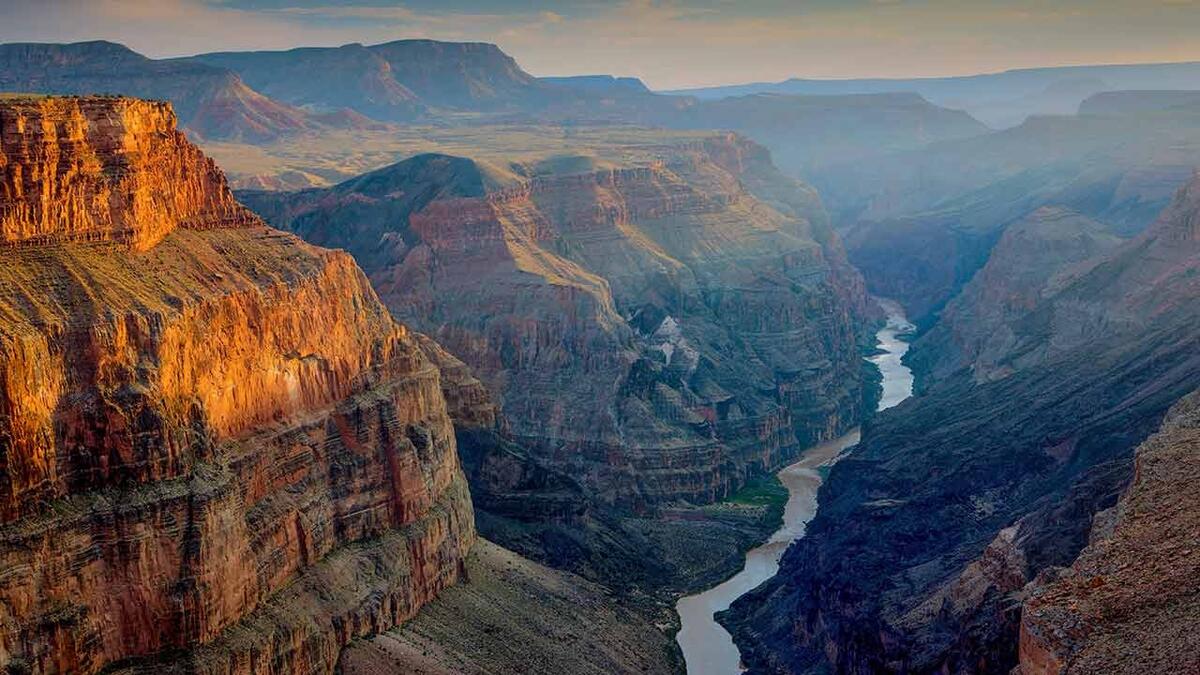
The visible waterline of Lake Mead, which is fed by the Colorado River, illustrates the current water shortage. A two-decade drought and historic over-allocation have taken a toll on the Colorado River, and climate experts predict a hotter, drier future. With the pressure of new water restrictions that took effect in 2022, more Arizonans are wondering what the shortage means for them. Photo courtesy Shutterstock
Fixing trickle-down river data
Drought has taken a toll on the Colorado River for over two decades, and climate experts predict a hotter, drier future. Historic over-allocation of Colorado River supplies has added to these pressures. Current models of the river offer big-picture information, but don’t get down to the impacts on communities or irrigation districts. This makes it hard for local water managers to make informed decisions.
“What you need to know if you're a city water resources adviser is different from what you need to know if you are the U.S. Bureau of Reclamation or the Central Arizona Project,” Porter says.
It's really important for the 40 million people who rely on Colorado River water to have a good idea of what kinds of supply choices there are in the future.
— Sarah Porter, Kyl Center director
The Arizona CuRVE Project aims to democratize information about the Colorado River shortage. This means not only making that data available and easy to understand, but also presenting that data in a politically neutral way. The project gives water users a safe space to converse and see the true effects of different water policy choices.
“The way that the Colorado River is allocated during shortage conditions depends on literally hundreds of different contracts, laws and regulations,” says Kathryn Sorensen, the director of research at the Kyl Center. “We want to distill that information in a useful and neutral manner so that people can do the exploring on their own and come to their own conclusions.”
A fount of information for Arizonans
While seven western U.S. states and northern Mexico depend on the Colorado River, the CuRVE Project focuses on the shortage impacts in Arizona. The visualization tool will be most helpful for Colorado River entitlement holders, such as irrigation districts, mines, power companies, cities and tribes. It will allow users to walk through different water scenarios in Arizona, interact with hydrologic models and explore the outcomes of different policy decisions.
By seeing how the shortage and policy decisions will affect other sectors as well as their own, Porter hopes that the tool will help water managers find new possibilities for mutually beneficial water transactions. But you don’t have to be a water manager to use it.
“This tool is also going to be helpful for individuals who are reading the news about shortage and are concerned. It's going to help them get a better idea of what the real risks are to them personally or to their community,” Porter says. “Our hope is that it would help people who want to become more involved in water decisions.”

Decision Theater is creating a digital tool that anyone can access online to understand how the Colorado River shortage affects them. Visitors to Decision Theater will also be able to walk through the CuRVE Project tool in the 360-degree, immersive digital environment known as the Drum, pictured here. Photo by Andy DeLisle/ASU
Current methods
The Kyl Center, part of the Morrison Institute for Public Policy, promotes research and collaboration to support sound water stewardship for Arizona and the western U.S. But to bring its water data to life and create the CuRVE Project tool, the center turned to ASU’s modeling and data visualization powerhouse, Decision Theater.
Decision Theater’s goal is to bring leaders and experts together in a neutral space to understand and solve complex issues, using interactive models that it creates with its advanced technical capabilities.
“The management of water, especially in a shared system, is about as complex as it gets,” says Jon Miller, director of Decision Theater.
The Kyl Center developed databases that hold information about who has allocations of Colorado River water and how the allocations change during a shortage, as well as central Arizona water providers’ sources and uses of water.
Decision Theater is combining these databases and translating them into a publicly accessible digital tool. This tool will let people experiment with different choices as they respond to water shortage and policy scenarios. Visitors to Decision Theater will also be able to walk through the CuRVE Project tool in the 360-degree, immersive digital environment known as the Drum.
“The collaborative nature of the Decision Theater approach brings many stakeholder perspectives together, while the integrated and visualized data provides a fact-based understanding of this complex problem. Decision Theater will not detail the perfect solution to the critically important water management problem. It will provide a forum for informed, fact-based stakeholder engagements leading to better decisions made by more informed decision-makers,” Miller says.
Data stream of stream data
Big cities in the state typically have multiple water sources, such as groundwater, reclaimed water and water from other rivers like the Salt River and Verde River.
Because of this, the databases that feed the CuRVE Project pull water information not just from the Colorado River, but from many other sources as well. This is a key part of what makes the tool so practical. As available water from the Colorado River goes down, the CuRVE Project can show how reliance on the other water sources changes.
“For example, we know that communities will turn to groundwater, which is a finite resource. When you look at everyone using a lot more groundwater, that has implications for long-term water supply,” Porter says. “By providing this granular information, we help people start to think more holistically about the situation.”
Tapping into multiple perspectives
To help inform the types of questions the CuRVE Project tool should address, the team assembled a steering committee that includes ASU experts, such as Professor Dave White, associate vice president of research advancement, and Assistant Professor Margaret Garcia, as well as a variety of Arizona water managers from mines, power companies, tribal communities, cities, agriculture and private water systems.
“We've been careful to include representatives on our steering committee from all of these different groups. We want to make sure that everybody's perspective is represented as we build the tool,” Sorensen says.
The committee gave input on the different types of hydrologic scenarios, policy options and shortage algorithms that they might want to explore with the tool. Sorensen herself also brings valuable insider perspective to the project; she is a water economist who formerly ran water utilities for the cities of Phoenix and Mesa.
Charting the future of water
Decision Theater is currently building out the tool’s simulations, which are based on authoritative research on possibilities of snowpack — a key source of water for the Colorado River — and possibilities of how water demand and use could change.
“A simple example would be, what if we had a spell of three or four years of below-average snowpack now, when the reservoirs are at an all-time low? What would that mean?” Porter says.
A broad range of such scenarios will allow CuRVE Project users to examine the impact of different policy choices in those contexts.
“In all of our development activities, we work closely with collaborators and clients to create custom solutions satisfying the needs of all stakeholders, such as scientists trying to communicate complex problems, users of the tool and decision-makers who are informed by the tool’s outputs,” Miller says. “Our goal is to foster understanding and informed conversation through the creation of a data visualization tool that accurately presents information in an easily digestible manner.”
Sorensen notes that while the tool will focus on modeling the shortage of the Colorado River, it isn’t about predicting waterless doom. Instead, users will find insights into Arizona’s other available water sources.
“The problems on the Colorado River are critical, and there are some huge challenges ahead of us. But Arizonans have long known that this day would come, and for the most part, do have plans and alternative supplies that they can rely on when there isn't enough Colorado River to go around. We’re going to present the model in that context,” she says.
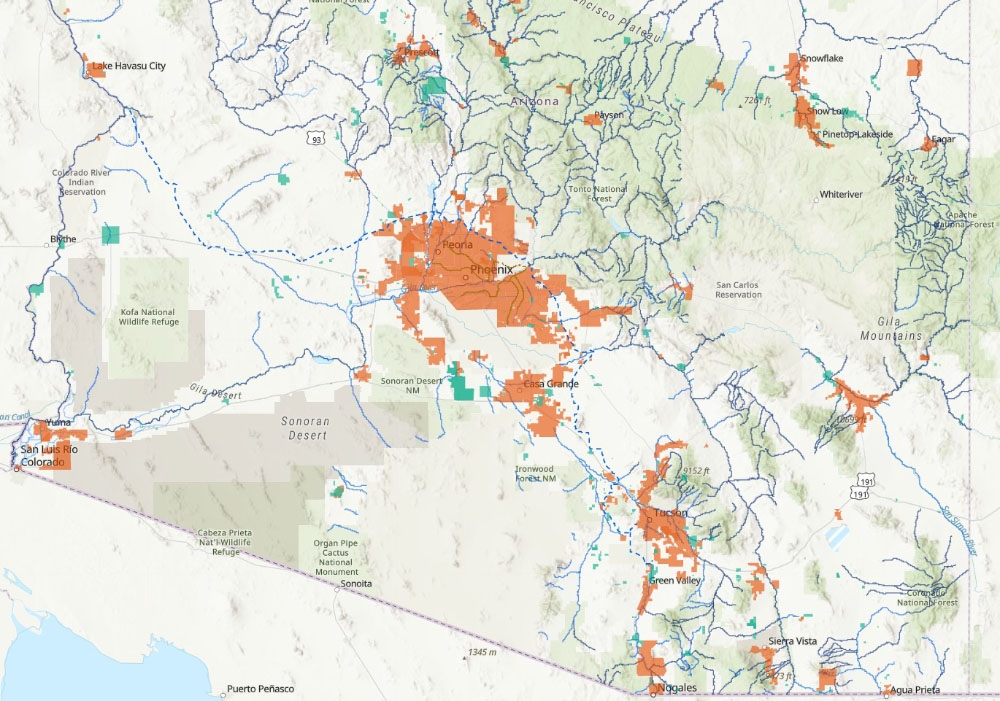
Click to interact with map. This map from the Arizona Water Blueprint shows the Central Arizona Project and Salt River Project canals, rivers and streams, and community water system service areas in central and southern Arizona. Image courtesy Arizona Water Blueprint, Kyl Center for Water Policy
Be water-wise, my friend
The Arizona CuRVE Project represents the next natural step for the Kyl Center, which has been supporting productive water discussions in the state since 2015.
“I think the way we best serve Arizona is that, as part of Morrison Institute for Public Policy, we don't have any specific interests. We are truly neutral in water policy discussions, because we are not an irrigation district or a city,” Porter says. “That gives us a freedom and perspective that most of the people in water discussions in Arizona don't have.”
In addition to publishing a number of policy papers, the center also developed the Arizona Water Blueprint, an interactive map of the state’s water resources and infrastructure that offers data visualizations and multimedia content on important water-related topics.
“We are fundamentally trying to improve decision-making around water resources and make sure that people who want to be involved have access to the information that they need,” Porter says.
Learn more about the Colorado River water shortage and stay up to date on the CuRVE Project.
The Arizona Colorado River Visualization Enterprise is partially funded by the Walton Family Foundation.
Top photo courtesy Shutterstock.
More Environment and sustainability

'Earth Day Amplified' promotes power of collective action
Everybody loves the concept of sustainability. They want to do their part, and the chance to say they’ve contributed to the well-being our of planet.But what does that actually mean?Arizona State…

Rethinking Water West conference explores sustainable solutions
How do you secure a future with clean, affordable water for fast-growing populations in places that are contending with unending drought, rising heat and a lot of outdated water supply infrastructure…

Meet the young students who designed an ocean-cleaning robot
A classroom in the middle of the Sonoran Desert might be the last place you’d expect to find ocean research — but that’s exactly what’s happening at Harvest Preparatory Academy in Yuma, Arizona.…