ASU and Helios Education Foundation debut tools to track education progress and test interventions
Two years ago, Arizona State University and Helios Education Foundation began conversations about how the two organizations could work together to provide the state with better information and data on Arizona’s education system.
“We have a lot of data systems that are separate and distinct, but nothing that provides a comprehensive way to look at the education system,” said Vince Yanez, senior vice president of community engagement for Helios Education Foundation. “Early education data doesn’t necessarily talk to the data in K-12, which doesn’t talk to the data in higher education.”
The Decision Center for Educational Excellence, powered by Helios Education Foundation, was launched in 2018 as a means to address this disconnect and provide school administrators, policymakers and elected officials with the tools and information needed to address educational deficiencies in the state and increase student achievement. Joe O’Reilly, one of the state’s leading experts on education research and data, was brought on to direct the center.
“The idea is, if we can bring together all the data we have on the education system in Arizona, apply the resources and knowledge of Helios and ASU and bring stakeholders together to discuss where we’re at and where we’re heading, we will have significantly better student outcomes, and that will result in significantly better community outcomes, family outcomes and state outcomes,” said O’Reilly.
New tool to pinpoint bright spots and test interventions
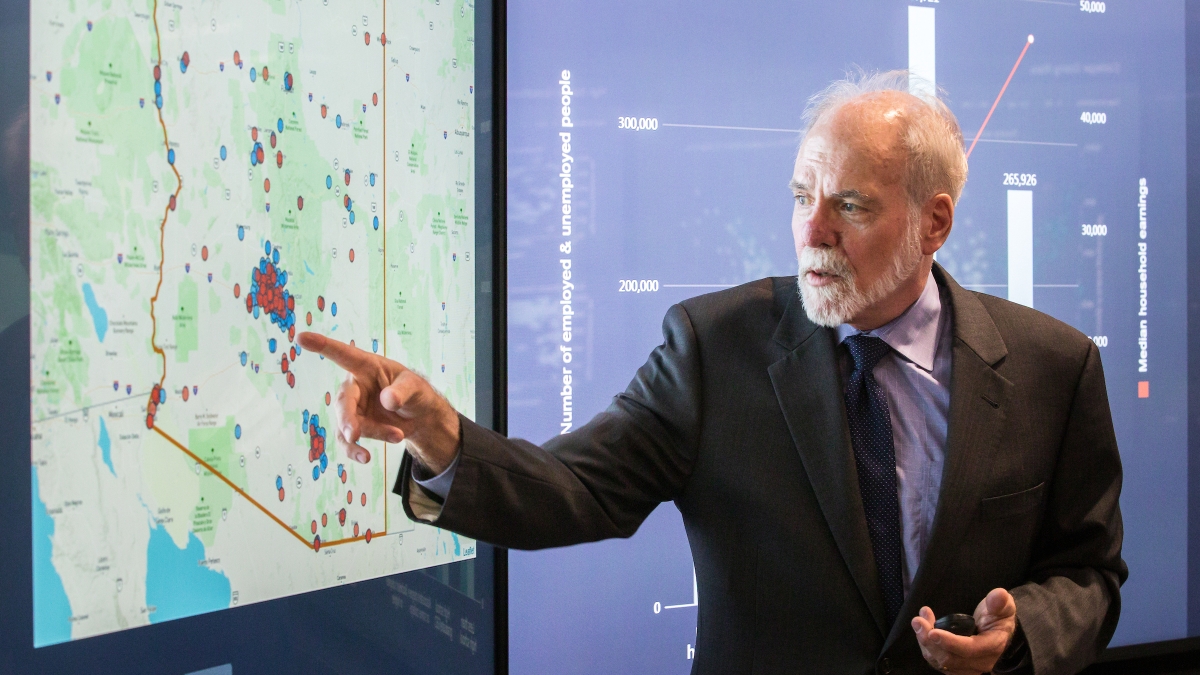
For the past year, O’Reilly and his team, which includes the Decision Theater and ASU engineering students, have been building a first-of-its-kind, interactive model of Arizona’s K-12 education system. The model offers stakeholders the ability to test the impact of potential policies on education outcomes, pinpoint scalable bright spots in the state’s education system and identify strategies that could improve student performance.
“There are over 220 school districts in the state. There are over 500 charters in the state. Each of those systems and each of those schools are unique,” said Vince Roig, founding chairman of the board of Helios Education Foundation. “One of the powerful things about this work is you’ll be able to look at possible interventions, possible allocations of resources, for all of those different systems in a way that’s not cookie-cutter, that’s not overly prescribed. We’ve never been able to do that before.”
The model draws on 2016 data — the first data publicly available — from a variety of sources, including the Arizona Department of Education, the U.S. Census Bureau, the National Center for Educational Statistics, the FBI, the Environmental Protection Administration, the U.S. Department of Education's Office of Civil Rights and individual Arizona schools.
Tracking progress at the local level
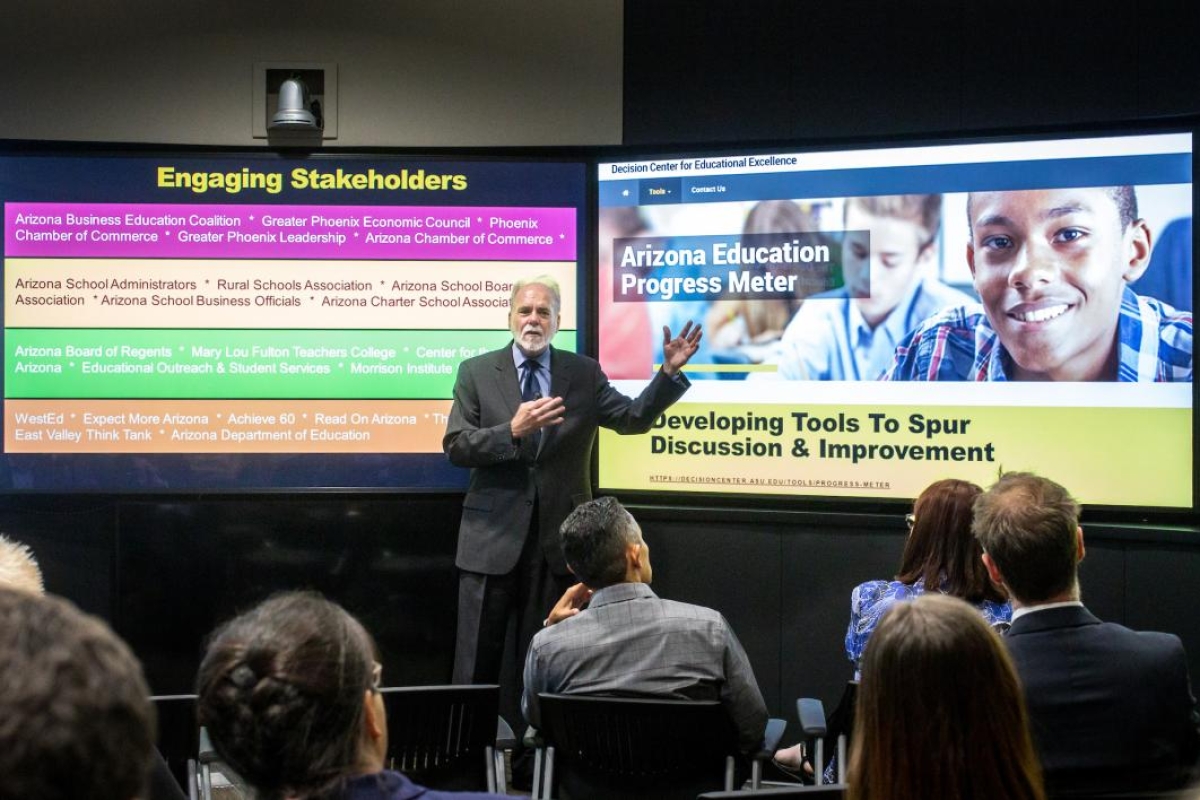
The center, working with Expect More Arizona and the Center for the Future of Arizona, has also made a significant upgrade to the Arizona Education Progress Meter — a tool designed to offer reliable information on where Arizona stands as a state on issues ranging from access to quality early learning to postsecondary attainment. The tool now allows stakeholders to choose specific cities and towns, schools or school districts and track progress toward the goals at the local level.
Collectively, these tools will give Arizona’s education stakeholders the ability to deeply understand the state’s education system, discuss local conditions and implement changes, either at the individual school level or across the board, that will support a high-quality education for all Arizona students.
Unveiling the tools and key takeaways
“How do we significantly improve the outcomes of education in Arizona, so we can improve Arizona?”
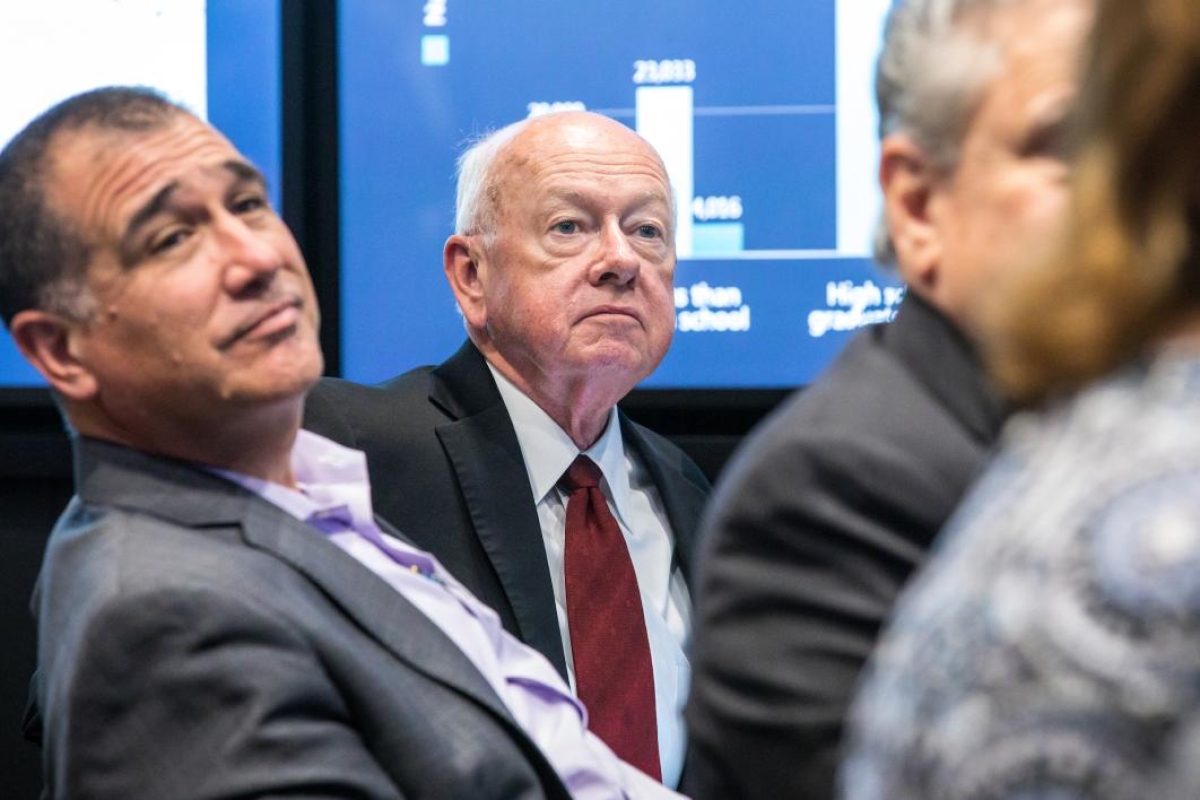
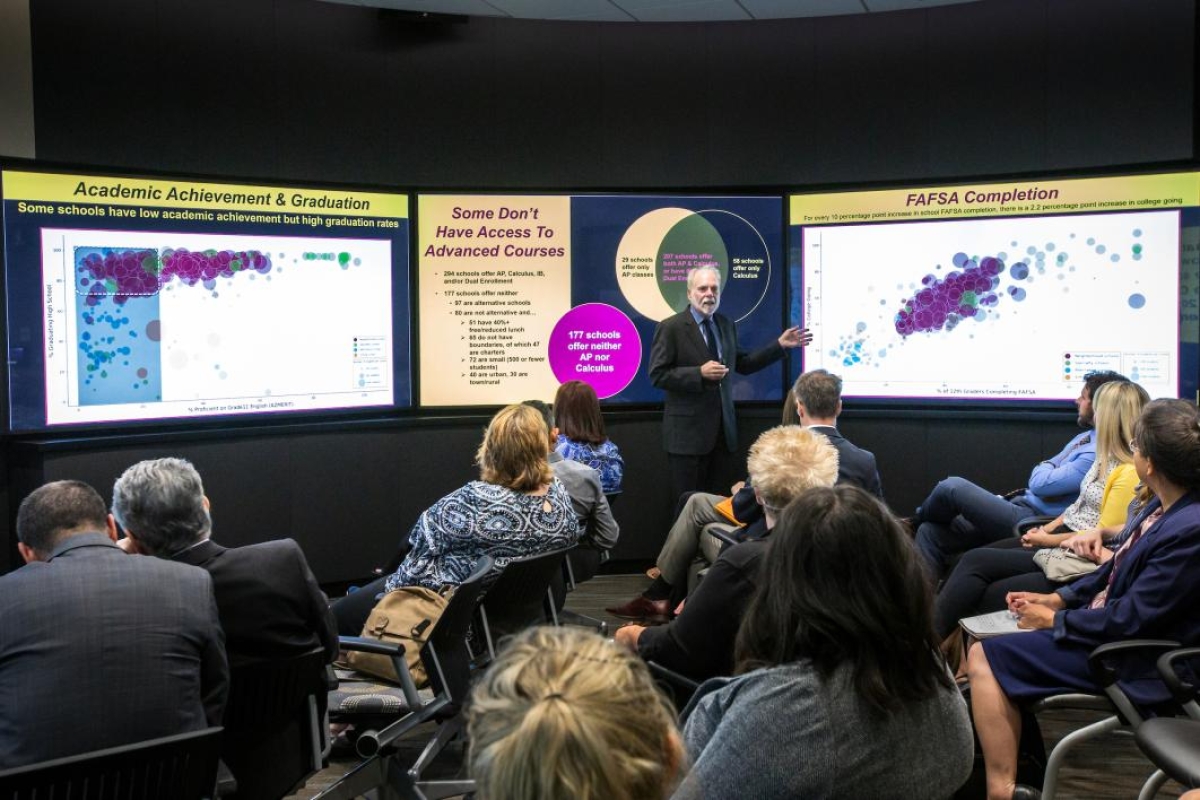
This was the question posed by O’Reilly as he unveiled the new tools at a public event this week in the drum of Tempe’s Decision Theater. Arizona’s education administrators, policymakers, business leaders and community members gathered to learn about the new tools created by the Decision Center for Educational Excellence.
Before introducing the tools, O’Reilly shared three key takeaways about the state’s education system that an analysis of the 2016 data revealed:
1. Poverty does not determine graduation rates, but it does impact academic achievement.
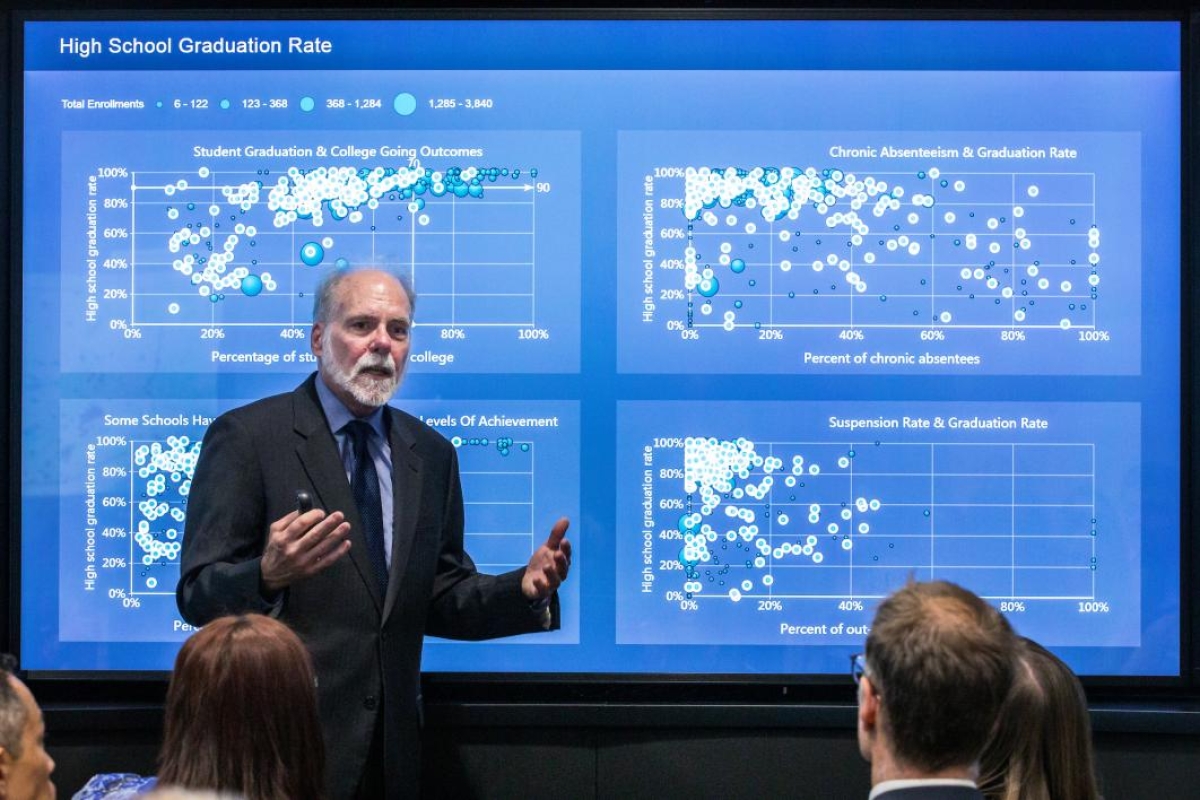
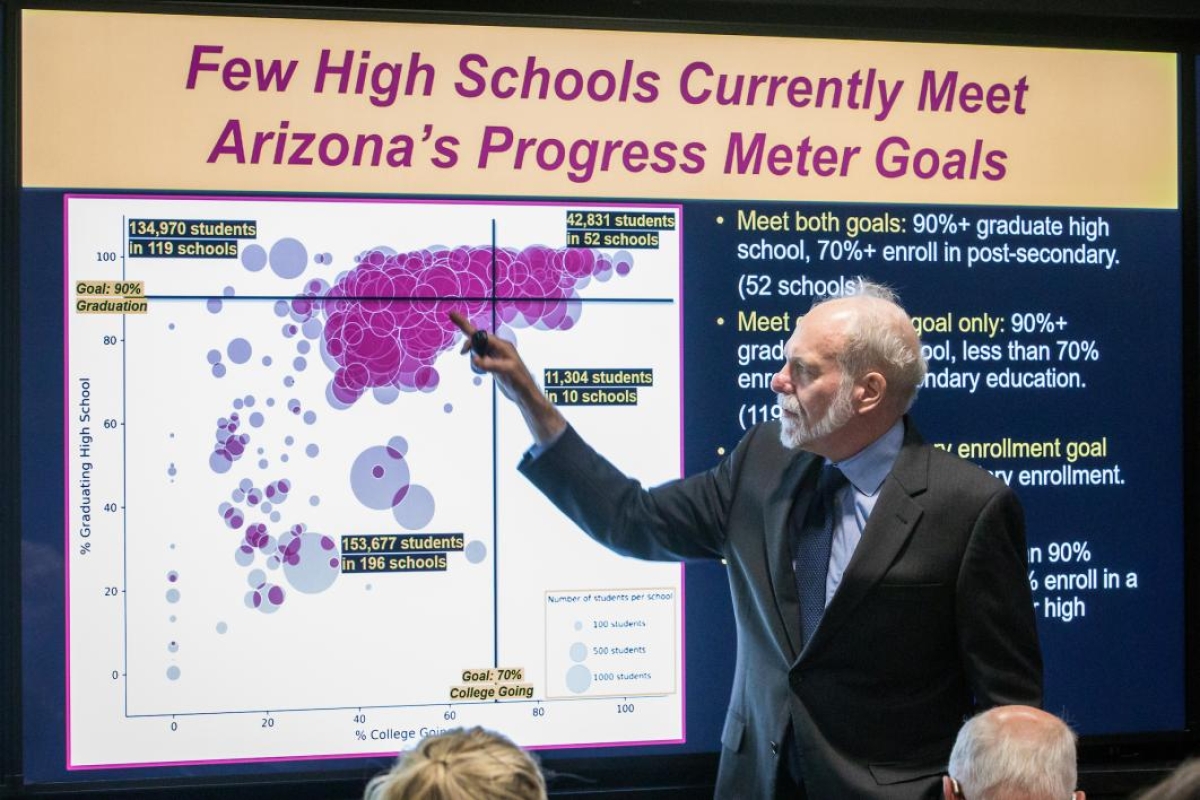
Contrary to common belief, no correlation was found between poverty levels and high school graduation rates. “Whether a school has high rates of poverty or low, the graduation rate is, on average, the same,” said O’Reilly.
“However, many high-poverty schools have fewer graduates that are ready for college-level work, and fewer going to college,” said O’Reilly. “But we also find high-poverty schools with higher achievement and college-going rates, so we need to learn more about how they are accomplishing that.”
For example, the data show that 92% of the students attending Phoenix Union’s Franklin Police and Fire High School are low income, yet 97% graduate on time and 70% go to college. Similarly, almost 70% of Nogales High School students are low income, yet 95% graduate on time.
2. FAFSA completion is a leading indicator of college-going.
Controlling for student characteristics, for every 10% increase in FAFSA completion rates there is a 2.2% increase in college-going rates.
“This is not because filling out a form causes a student to go to college,” said O’Reilly. “But it may reflect a school’s college-going culture, and may be one of a number of strategies by the school and parents to encourage students to attend college.”
The model shows that many of the schools with high FAFSA completion rates are also high-income schools, such as Catalina Foothills in Tucson. However, there are also low-income schools, such as San Luis High School on the border south of Yuma, where 64% of students complete the FAFSA and even more — 76% — go to college.
3. There is a lack of rigorous courses available.
More than one-third of the high schools in Arizona do not offer students the opportunity to take rigorous courses such as advanced placement, International Baccalaureate, dual enrollment or even just calculus.
“We assume students have ability, and that range of ability is widely shared, but the opportunity to develop that ability is not everywhere,” said O’Reilly. “And that’s the challenge that we see here.”
Students with the potential to be leading engineers, doctors and scientists can be found in communities throughout Arizona, but without the opportunity to accelerate their learning, they may never be able to compete for top spots in these fields.
“They may have dreams, they may have the innate ability, but that ability needs to be developed,” he said.
Building on the model in Year 2
Over the coming months, O’Reilly plans to share the tools with education stakeholders around the state.
“We are really proud of Joe and the team and the tools they are putting in the hands of policy makers and school administrators,” said Luke Tate, associate vice president and executive director of opportunity initiatives at ASU. “We need more data and evidence to guide our decision-making.”
Data will continue to be added to the system in perpetuity, allowing for the analysis of education trends over time and the development of strategies, locally and statewide, to increase student success.
For example, the tool could identify high schools in a particular county that have large populations of Spanish-speaking students and a high percent of students receiving free or reduced lunches, but also high achievement scores. Schools with a similar demographic profile but with low achievement scores could look to those better-performing schools to identify what interventions could be implemented at their own school to improve student achievement.
As another example, city leaders might be interested in learning how increasing the college-going rate in their city will affect average incomes and the city’s income tax profile. Or, they may want to see how their college-going rate compares with a neighboring city with a similar demographic and economic profile.
“There are so many possible uses of the system — you can’t list them all,” said Roig. “We’ll be able to see what’s working, what’s not and what changes need to be made. When you start talking about modeling the education system and potential interventions and what’s likely to have the most impact for students — the possibilities really are staggering.”
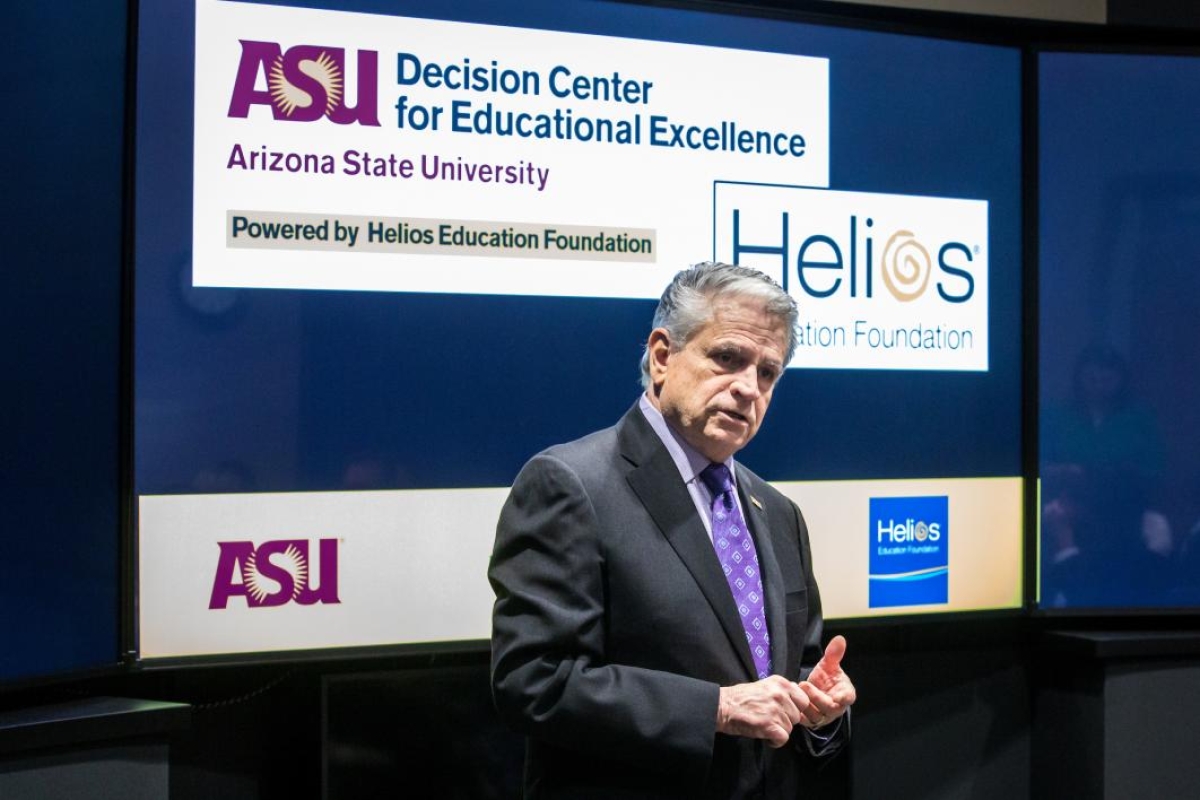
Top image: Joe O’Reilly, director of the Decision Center for Educational Excellence, powered by Helios Education Foundation, presents an interpretation of data on Arizona's K-12 education at the Decision Theater in Tempe on Tuesday. Photo by Charlie Leight/ASU Now
More Science and technology

ASU-led space telescope is ready to fly
The Star Planet Activity Research CubeSat, or SPARCS, a small space telescope that will monitor the flares and sunspot activity of low-mass stars, has now passed its pre-shipment review by NASA.…

ASU at the heart of the state's revitalized microelectronics industry
A stronger local economy, more reliable technology, and a future where our computers and devices do the impossible: that’s the transformation ASU is driving through its microelectronics research…

Breakthrough copper alloy achieves unprecedented high-temperature performance
A team of researchers from Arizona State University, the U.S. Army Research Laboratory, Lehigh University and Louisiana State University has developed a groundbreaking high-temperature copper alloy…


