The value of understanding hospital resources amid COVID-19

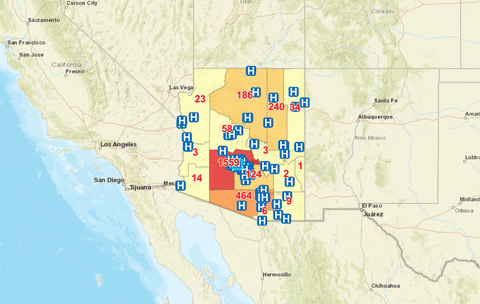
Screenshot of the interactive map featuring a wide view of Arizona.
As cases of COVID-19 rise in Arizona, it’s essential to take a closer look at the current hospital resources that are available in our state. A quick Google search can help you find the nearest hospital. Still, critical metrics like the number of hospital beds, availability of specialized ICU beds and average ventilator use per week are not so easy to find.
Arizona has a total of 15 counties, some like Maricopa and Pima, which boast dense populations with at least 1 million residents. On the other hand, Greenlee is the smallest Arizona county and has a population of less than 10,000. How do resources look across these counties?
Chuyuan “Carter” Wang, an assistant research professor for Arizona State University's Knowledge Exchange for Resilience and the School of Geographical Sciences and Urban Planning, weighs in with a mapping tool featuring four distinct layers including hospitals and hospital beds; confirmed COVID-19 cases by county; CDC social vulnerability index; and population by age group.
This interactive map is a powerful tool that increases knowledge of hospital resources available and paints a picture of where Arizona may need to allocate resources.
The first layer, titled Hospitals and Hospital Beds, shows the total number of licensed hospital beds in Arizona (17,889), 5.4% (1,882) of which are specialized ICU beds. A total of 46 hospitals have the potential to increase their bed capacity, with 25 hospitals located in Maricopa County and 11 in Pima County.
The second layer shows Confirmed COVID-19 Cases by County, and this data in comparison to the hospital resources can be alarming in some counties.
“As the COVID-19 cases increase, the demands of ICU beds and ventilators are also likely to increase in the next few weeks as well," Wang said. "Greenlee County has no hospital or hospital beds. Navajo County has 287 cases, but only 200 beds and 24 ICU beds potentially available as of April 10, 2020. These two counties need more attention from the ADHS and the state government."
The third layer, which shows the CDC Social Vulnerability Index helps people to more easily understand which populations have a heightened vulnerability risk based on census tracts.
“The SVI index ranges from zero to one, with higher values indicating greater vulnerability. The zero value means no vulnerability, and the one value means the greatest vulnerability,” Wang said.
The last layer includes Population by Age Group by Census Tract, which shows an overview of the population by age groups in Arizona. Based on the 2018 census data, there are more than 1 million residents age 65 and older in Arizona.
"It is still uncertain about which age group is the most vulnerable to COVID-19. But worldwide data shows that seniors aged 65 and older may be at higher risk. And they may experience severe symptoms due to underlying and preexisting health conditions," he added.
Above: An animation of the interactive map's zoom feature including a wide view of Arizona, then the city of Tempe and finally St. Joseph's Hospital and Medical Center hospital resource data. Explore the full map here.
In the most practical use, Arizona residents can use this map to find their nearby hospital and have more in-depth knowledge about the resources available to them. But, the value of these four combined layers can be used across sectors as combined knowledge of hospital resources and vulnerable populations creates a roadmap for areas of focus.
Dawn Augusta, a clinical associate professor for the Edson College of Nursing and Health Innovation and Knowledge Exchange for Resilience fellow works in developing innovative approaches to bridge education and health care systems design. She is also a registered nurse and has a nursing career that spans over 15 years.
When asked about the value of the interactive map, she said it can help people visualize the scarcity of resources and encourage a shift in attitudes about when to use hospital services.
“People are used to going to hospitals and often use emergency departments as primary care instead of true emergencies,” Augusta said.
Reserving the emergency department for people that need it the most, creates an opportunity for the industry to breathe and allocate resources more strategically.
With experience working on the front lines, Augusta said it’s an exhausting time for health care workers.
“It’s just a never-ending cycle. Each day the night shift hands the baton to the day shift and one back to the other. And you hope that every time you come back to give a report, it’s going to be a better story,” she added.
“The people in the hospital feel like they can’t do anything about the bottleneck, but the people in the community can loosen the grip,” she said.
Community members can make a difference if they properly isolate and participate in meticulous infection protocols like handwashing and not touching their face. The Centers for Disease Control and Prevention guidelines can offer more recommendations.
Another takeaway Augusta noted is the highly vulnerable population of 3,800 people experiencing homelessness in downtown Phoenix.
“Everyday people can look at this map and say wow, there is a scarce resource. There’s a huge risk of homeless people huddled in Phoenix getting sick very quickly, and all at the same time,” Augusta said.
With a surge in COVID-19 cases among people experiencing homelessness in Phoenix, it can affect neighboring cities since they could use Valleywide resources. She said Arizona needs to voice this concern.
“Let your concern be known to city leaders and ask them to make a strong commitment to finding places for people to go and get temporary emergency shelter. It doesn’t have to be forever. It’s not the new normal; it’s the new now,” Augusta said.
The ASU Knowledge Exchange for Resilience is supported by Virginia G. Piper Charitable Trust.The conclusions, views and opinions expressed in this article are those of the authors and do not necessarily reflect the official policy or position of the Virginia G. Piper Charitable Trust.
More Health and medicine

ASU grad dreams of helping hometown residents with a career in family medicine
Eliu Zaragoza When Eliu Zaragoza was in high school, he found himself especially drawn to his…

ASU grad finds purpose in serving her community through emergency medical services
Isabella Lirtzman Growing up in Scottsdale, Arizona, Isabella Lirtzman always knew she wanted…

What to know about Arizona’s measles outbreak
Arizona now has the second-largest outbreak of measles in the nation this year. Arizona State University’s Health…