Knowing the lay of the land is crucial for first responders during emergencies and for civic planners making decisions that direct a city's future. Natural disasters, however, have a way of drastically and suddenly changing that land.
Manoochehr Shirzaei, a geophysicist and radar remote sensing expert at Arizona State University's School of Earth and Space Exploration, specializes in satellites equipped with instruments that use highly accurate remote sensing, called Synthetic Aperture Radar. The data collected from these satellites allow Shirzaei to create high-resolution images of the Earth, with an emphasis on identifying sinking lands and flood zones. The maps are then provided to first responders as well as to public policy makers for long-term planning.
Question: What is a geophysicist, and how does that field relate to flooding caused by hurricanes like Harvey and Irma?
Answer: Geophysics is the study of the physical processes and physical property of Earth (and its surrounding space environment) by mapping the variations of physical property that are remotely sensed. In my case, I’m using satellites to study the Earth’s surface and specifically ground-level changes, which can be the result of natural causes or human-caused ones like extraction for water or fuel.
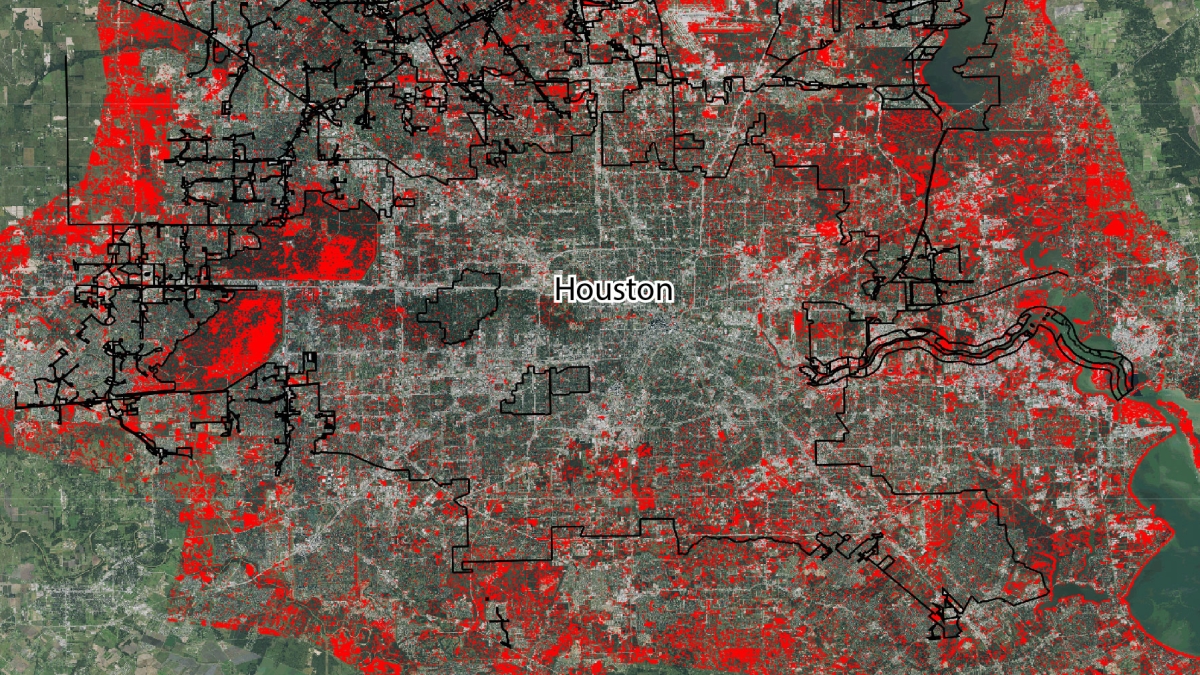
Q. You created a map of the Houston area with flooding caused by Hurricane Harvey (the map is pictured above, with flooded areas in red). How was this map created?
A: We acquired data from the Sentinel 1A/B satellites that belong to the European Space Agency. The instruments on these satellites use radar to provide highly accurate remote sensing data. There are two satellites that have a six-day revisit time (orbiting the Earth every six days), so we can compare an area before and after a disaster.
The raw images at first look like black and white dots, as if you were to spread large amounts of salt and pepper over a sheet of paper. Once we’ve processed the data, we can colorize the mapped areas based on levels of flooding.
See a larger version of the map here.
Q: How will the map be used?
A: During an intense storm, it is difficult to fly an airplane or drone over an affected area. And then clouds often are in the way of any satellite pictures that would show us what the flooding may look like. But radar can get through both clouds and rain.
This is helpful for first responders so they can determine where aid and relief is needed the most. It can also help with estimating the overall damage of an area.
In terms of forecasting, remote sensing is also useful to determine which land is above or below sea level and therefore more prone to flooding.
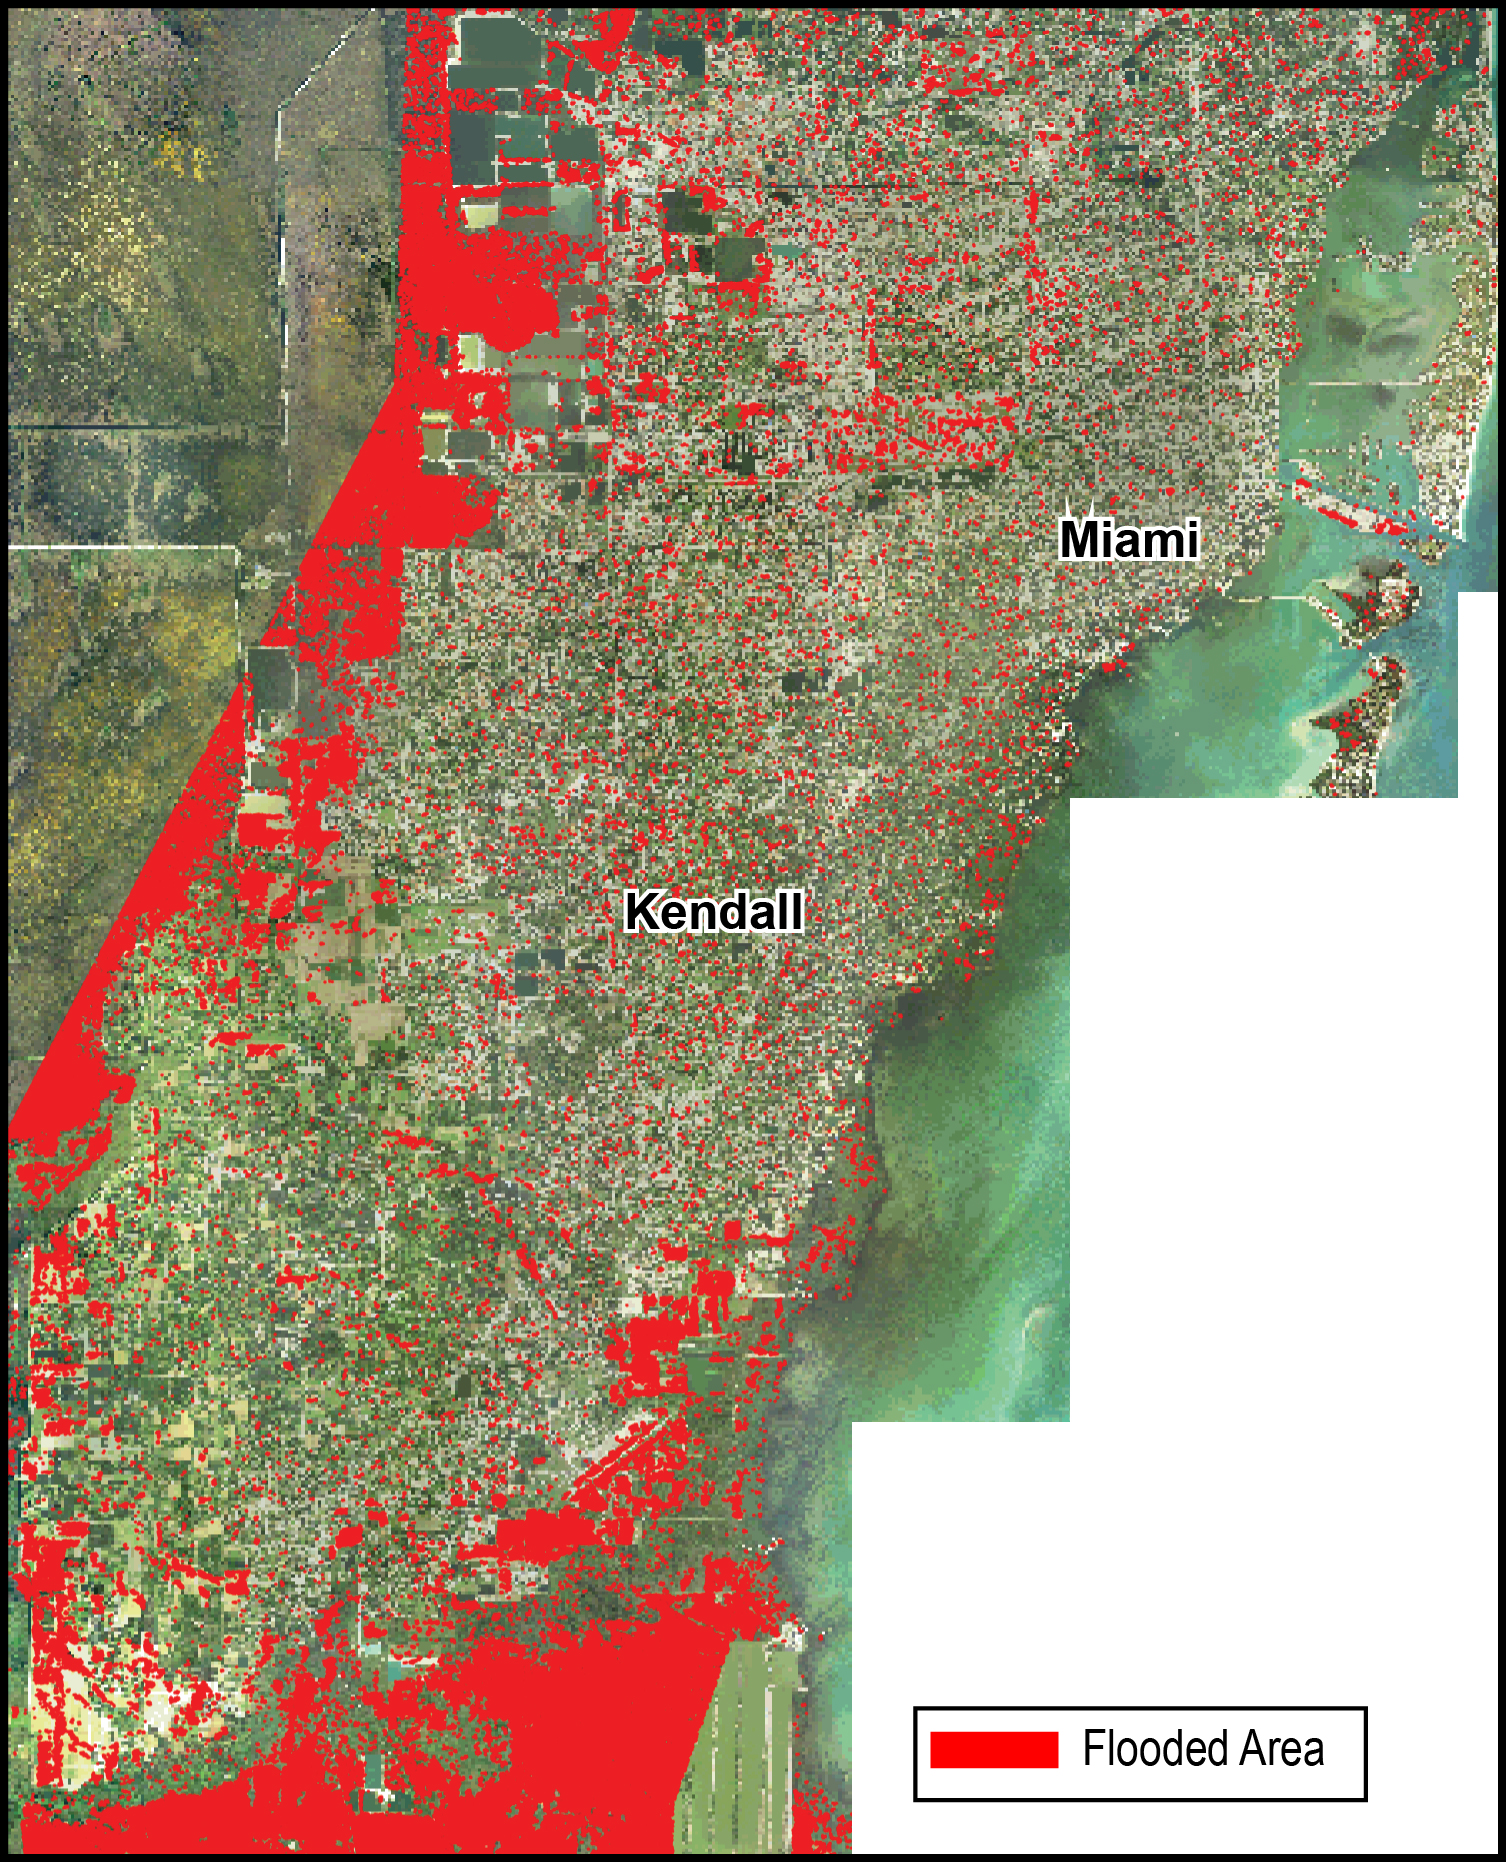
A map of southeast Florida flooding caused by Hurricane Irma generated from two C-Band SAR images acquired by Sentinel 1A/B satellites between Aug. 28 and Sept. 10. Image by Manoochehr Shirzaei
Q: And how did you create a similar map for the flooding caused by Hurricane Irma?
A: I contacted the European Space Agency in advance of the storm hitting Florida and requested data from their Sentinel 1A/B satellites. Once the storm hit and the data were available for the affected area, I began creating maps depicting the areas of flooding along the Florida coast. These maps are then provided to the appropriate local and national authorities so they can better assist those areas in need.
Q: You recently were recently selected to join the NASA Sea Level Change Team. What will you be doing for NASA as part of this team?
A: I will be working on mapping the U.S. coasts and studying the coastal land subsidence as well as the impact of sea-level rise on coastal flooding. NASA will use this data to inform local and national public authorities so that they can plan for flooding and infrastructure improvements, with the goal to minimize future damage.
Top photo: Map of Houston flooding caused by Hurricane Harvey generated from two C-Band SAR images acquired by Sentinel 1A/B satellites between Aug. 24 and 30. Image by Manoochehr Shirzaei
More Science and technology
ASU Interplanetary Lab celebrates 5 years of success
Five years ago, an Arizona State University student came up with the idea of creating a special satellite in what was then the newly built Interplanetary Laboratory. The idea was to design…

ASU secures NSF grant to advance data science literacy as demand soars
In an era where data permeates every facet of our lives, the importance of data literacy cannot be overstated. Recognizing this critical need, Jennifer Broatch, a professor at Arizona State…

Popular science author Steven Pinker explores rationale behind irrational thinking at ASU event
Popular science author Steven Pinker returned to Arizona State University’s Tempe campus on Feb. 7 for a rational talk about irrational thinking.More than 200 people filled Marston Exploration…

